

Carbon clarity in the petrochemical supply chain
First Year Report
Petrochemicals are integral to our modern way of life, but are also highly carbon-intensive, accounting for 17% of global industrial CO2 emissions.
The decarbonisation of the sector is challenging given the complexity of supply chains and thermodynamic constraints of the chemical reactions. Emissions are released throughout their life cycles, with varying stages dominating for different products. Mitigation options are therefore less straightforward than in other industries, requiring a system-wide approach. The nature of the sector also makes data collection and analysis challenging, meaning there is currently no reliable, comprehensive picture of GHG emissions or energy, mass, and trade flows of the petrochemical sector.
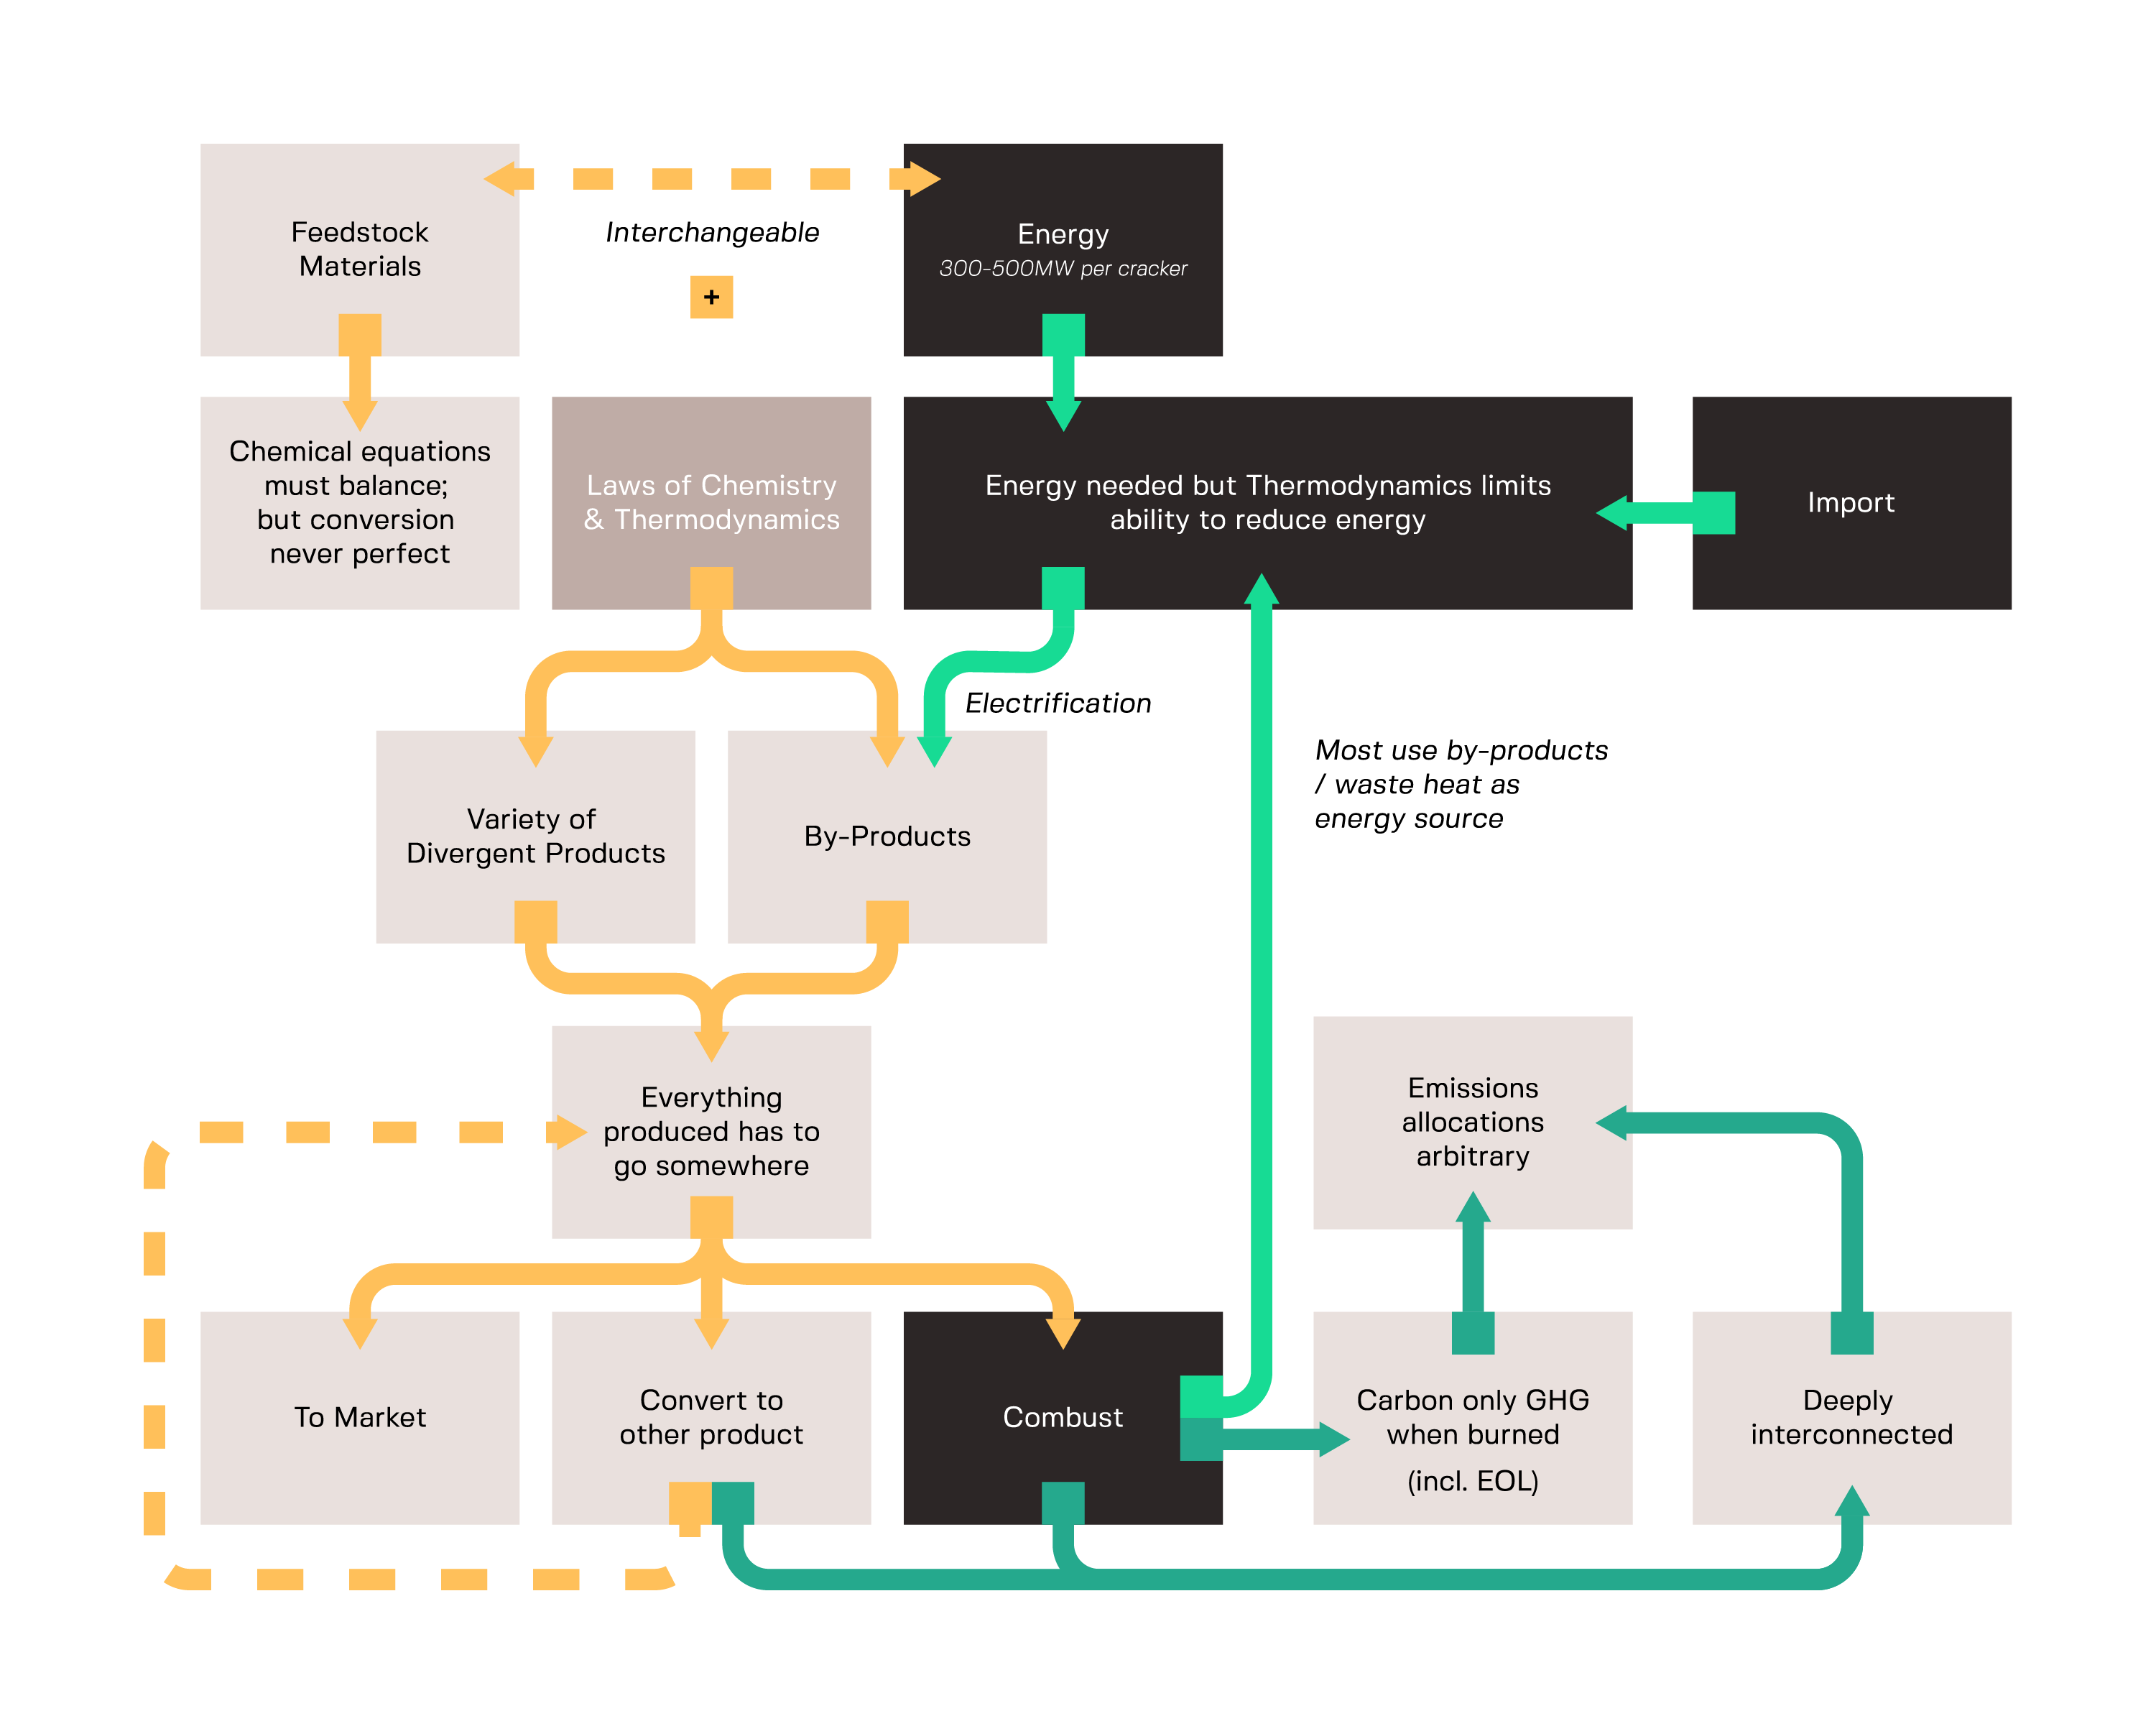
Figure 2–1: Why the petrochemicals industry is unique
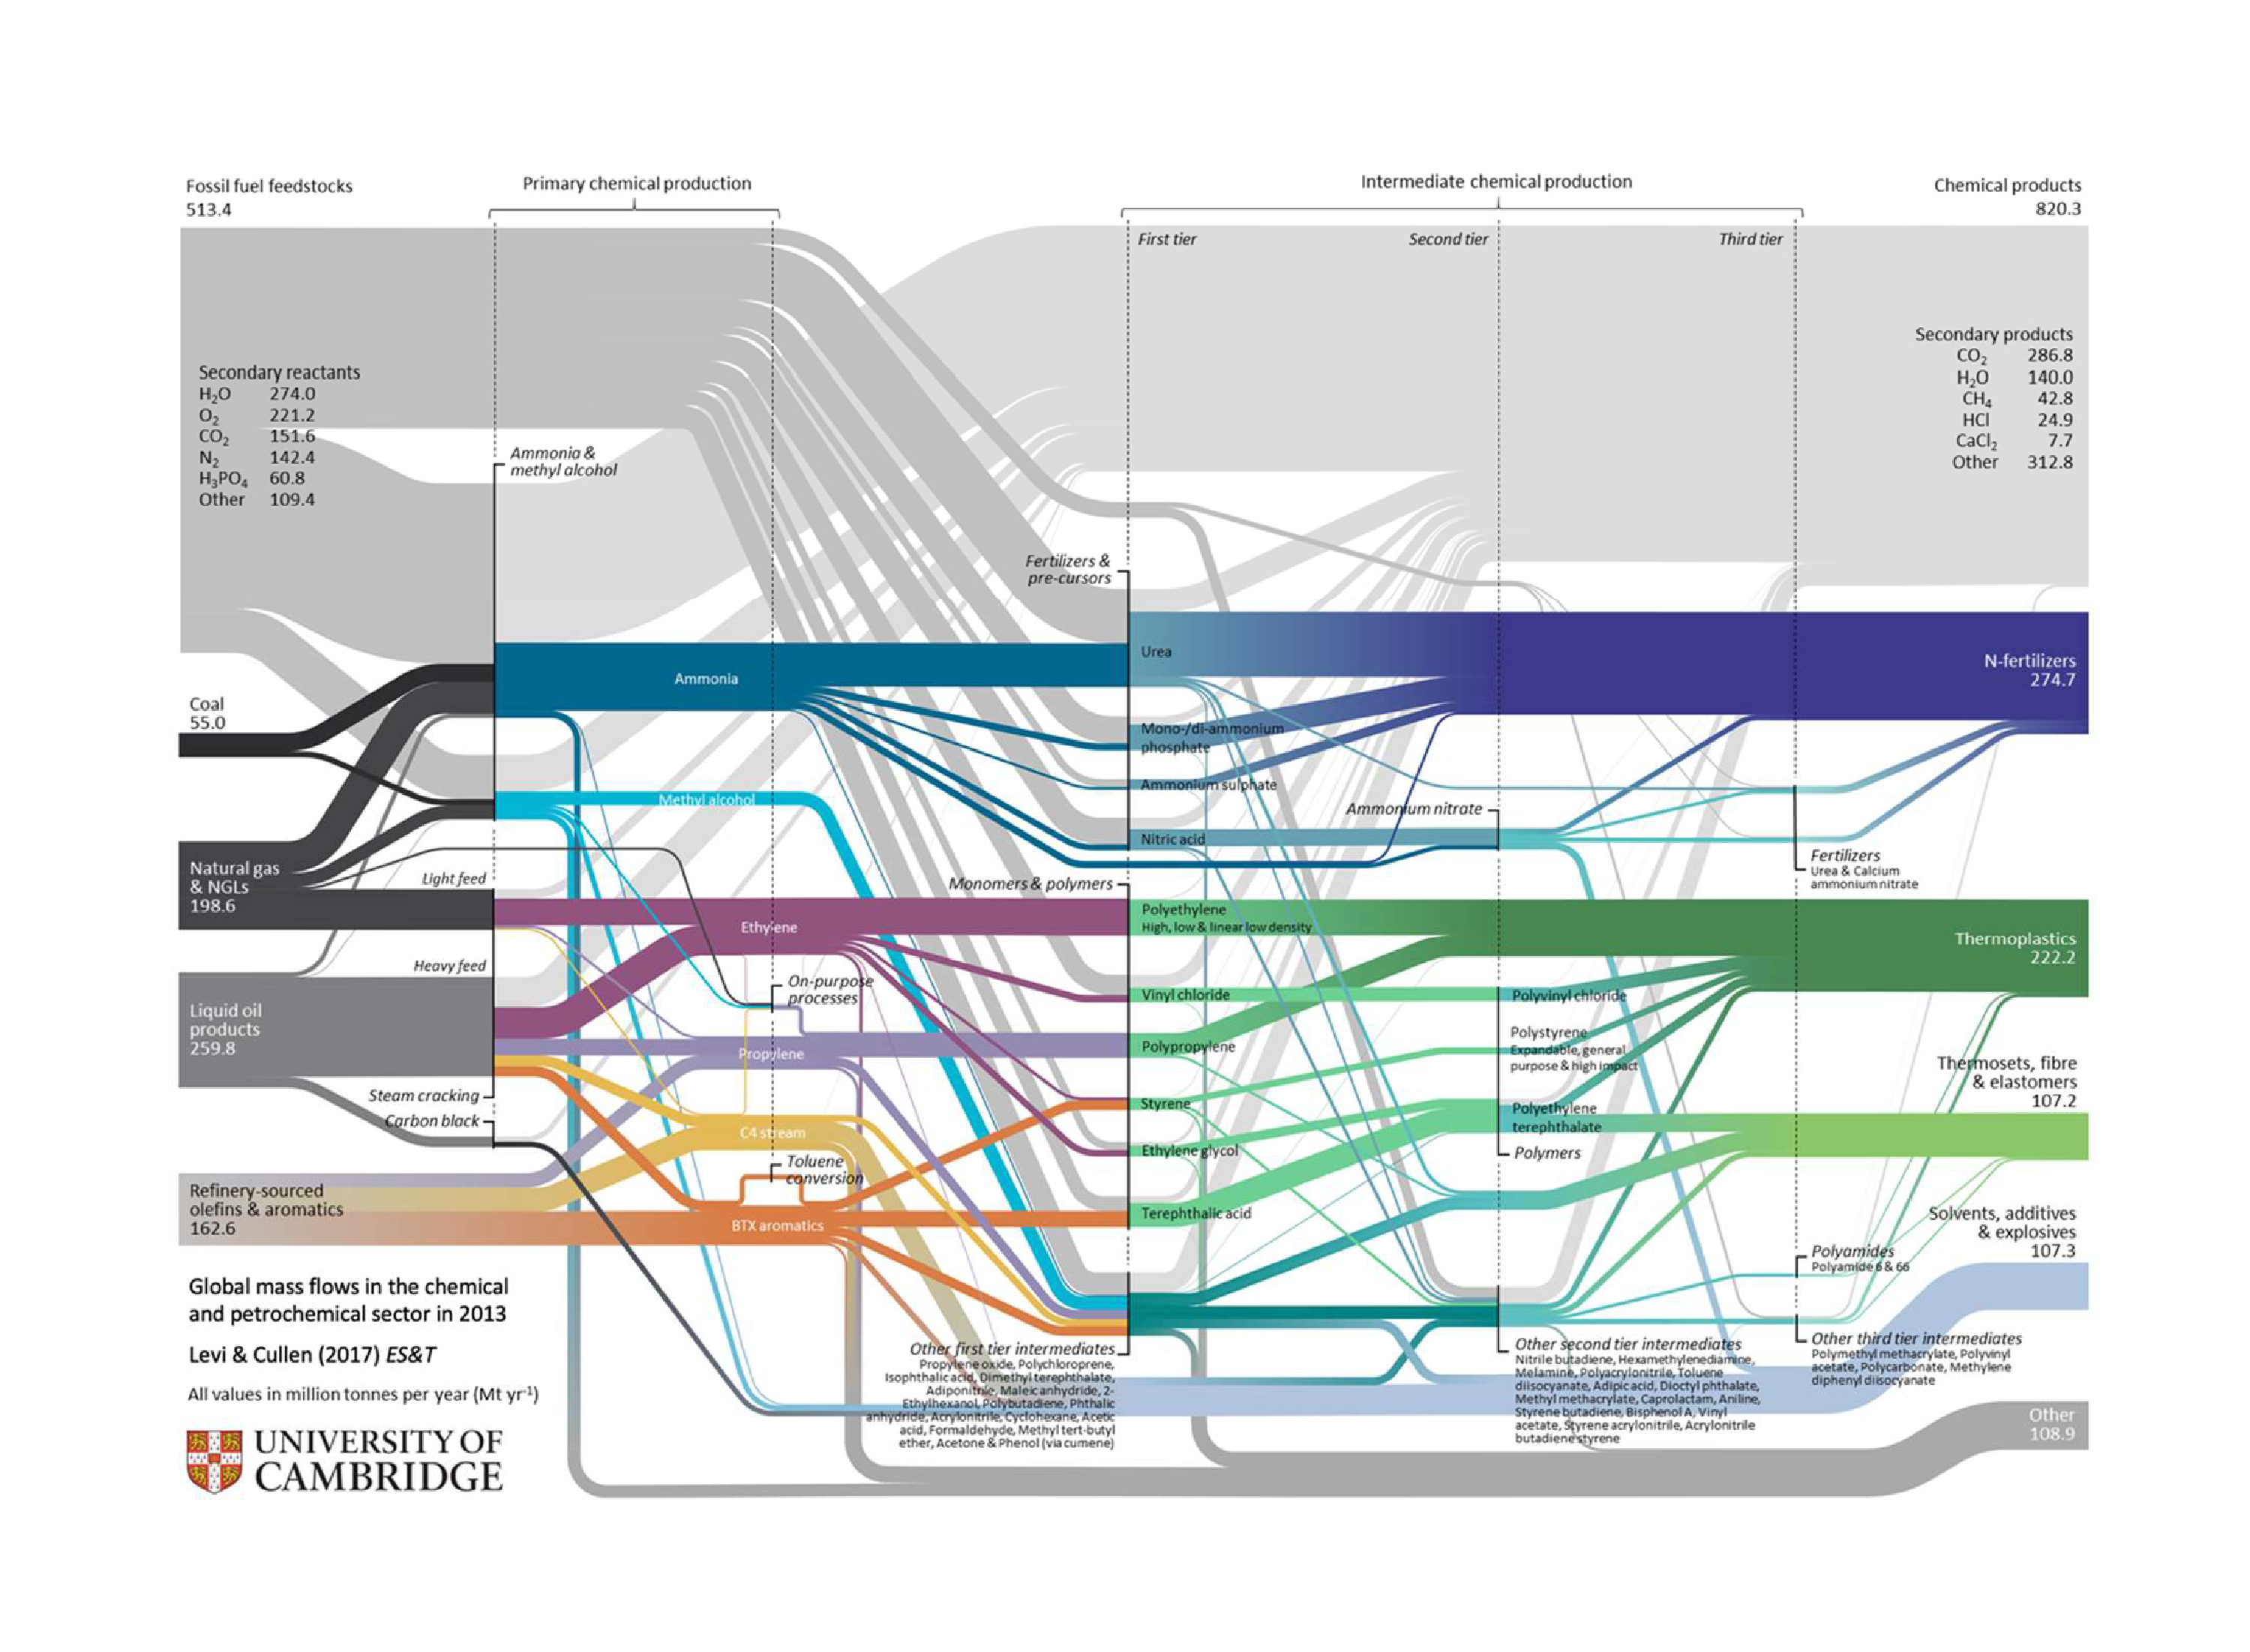
Figure 3–1: Levi & Cullen (2018) Sankey diagram showing 2013 material flows in the petrochemical sector
Our critical review of 33 emissions databases and 20 key studies revealed that the current method of gathering petrochemicals emissions data i.e., top-down methods, lack integration, transparency, and robustness.
There are inconsistencies and gaps in the data across six dimensions:
- Product – there is a scarcity of data on material flows through the highly interconnected supply chain.
- Life cycle stage – the emissions at extraction and end-of-life stages are not disaggregated at the product level.
- Region – some countries only report as the sector in total or do not have consistent monitoring standards.
- GHG emissions – there are inconsistencies in the methodologies used for aggregating emissions.
- Time series – data is not consistently collected over time.
- Uncertainty – only a minority of data sources explicitly consider uncertainty.
The current accounts do not allow us to answer the questions that we need answer to work towards net zero carbon emissions. The lack of clarity and transparency in published emissions data, both from companies and governments, heightens these difficulties. An alternative approach to top-down methods is to use derived measurement – bottom-up –where material flows are reconciled with the underlying chemical reactions, thermodynamic principles and carbon intensities to model GHG emissions.
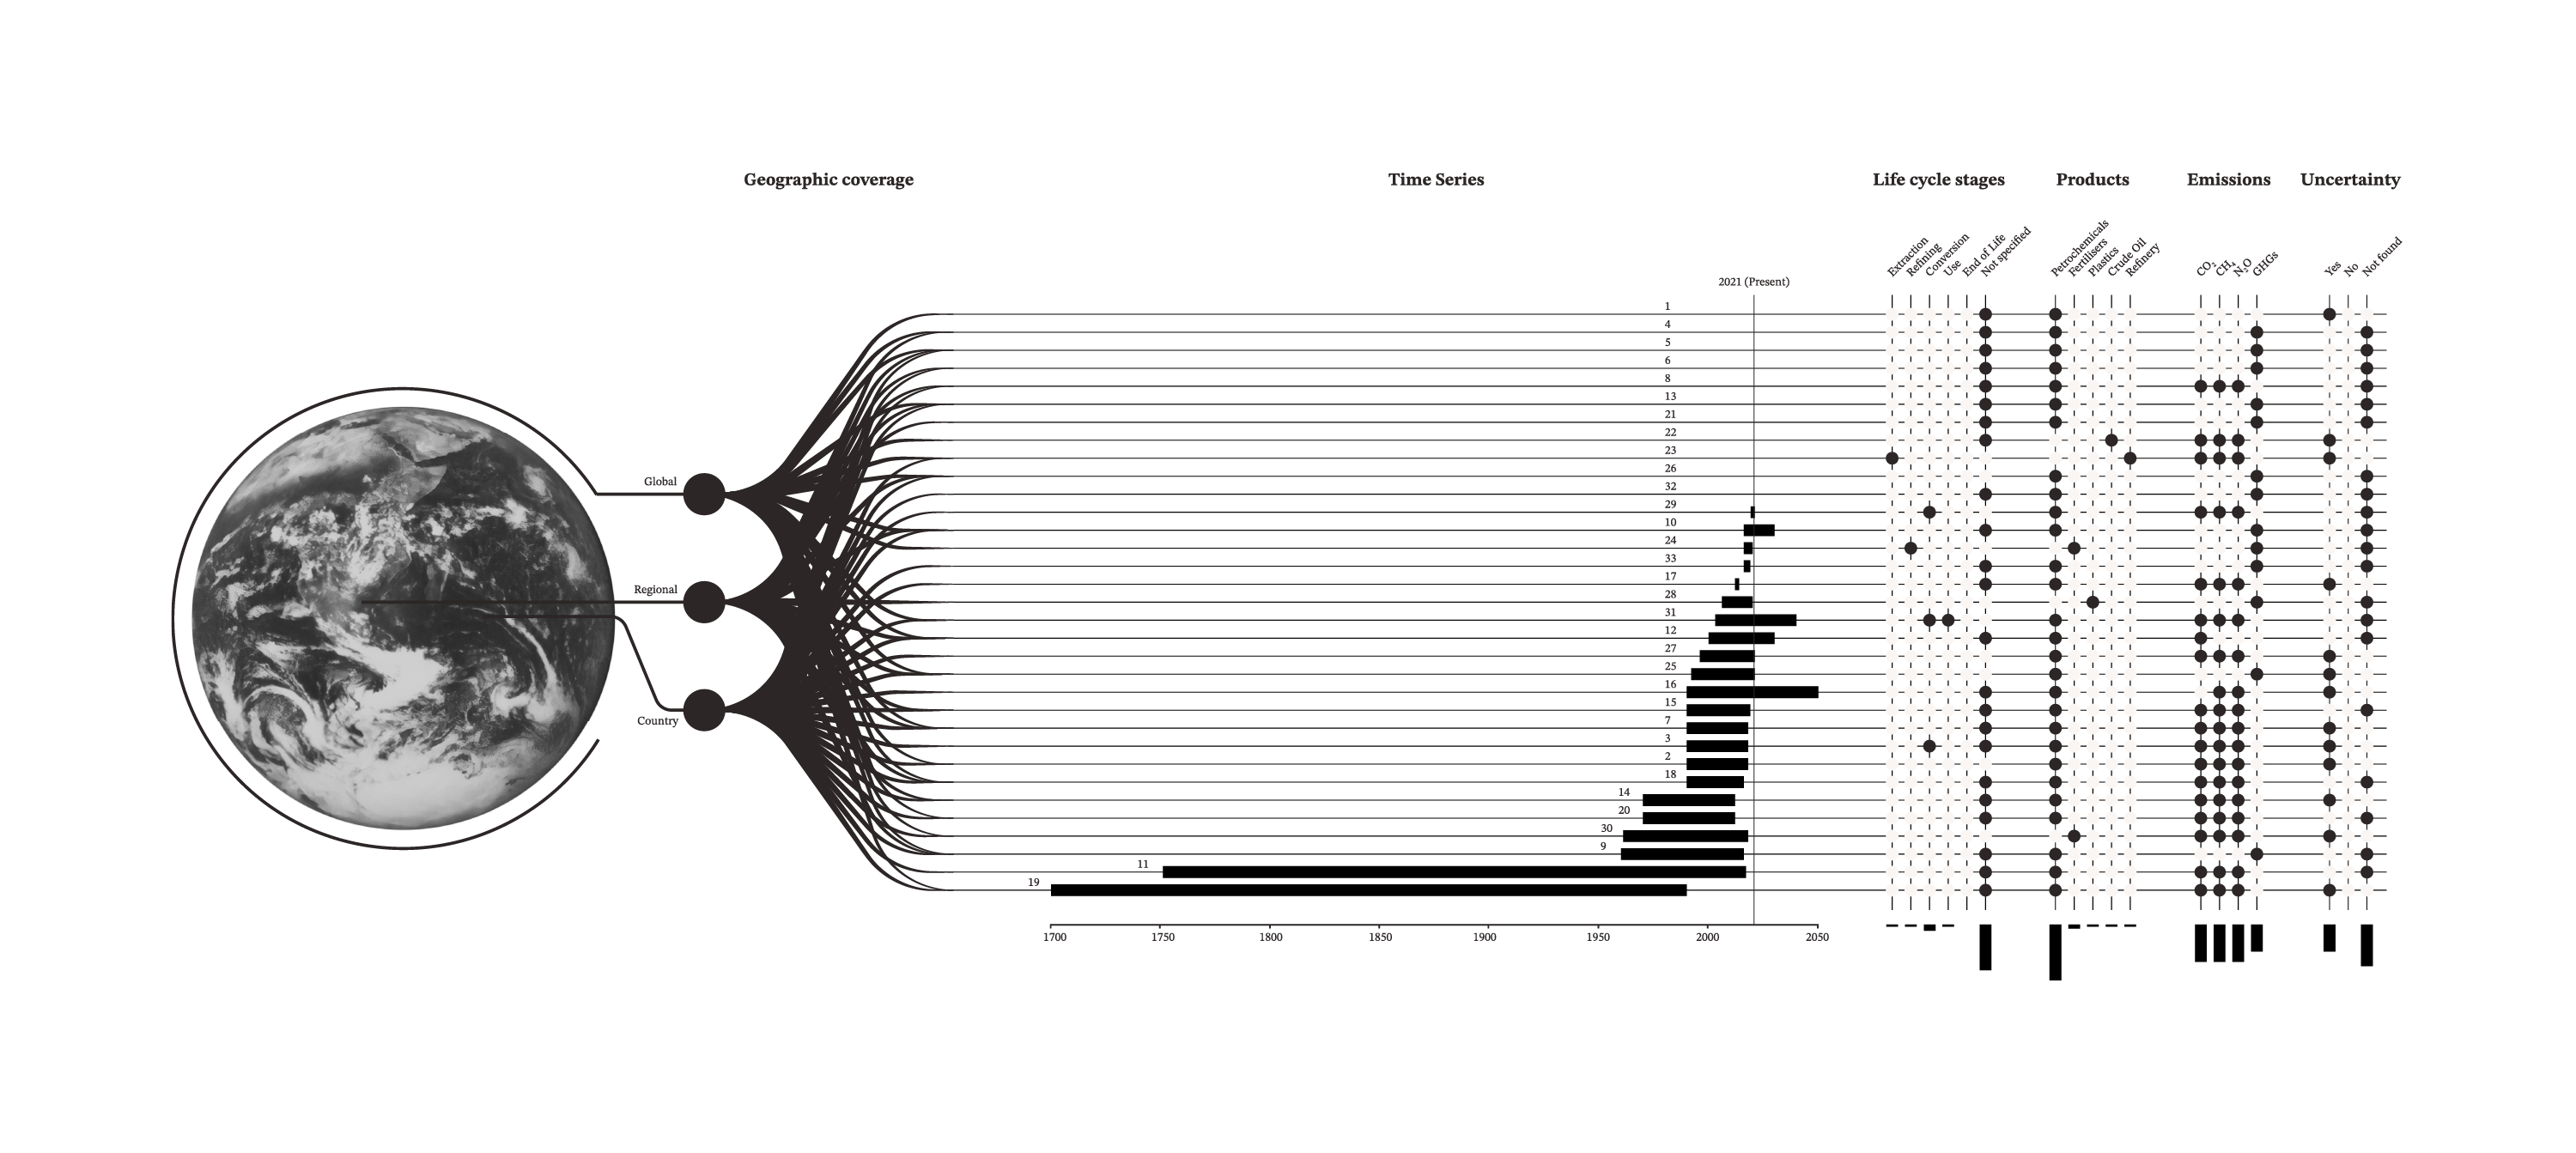
Figure 3–9: Time series reported in the primary data sources.
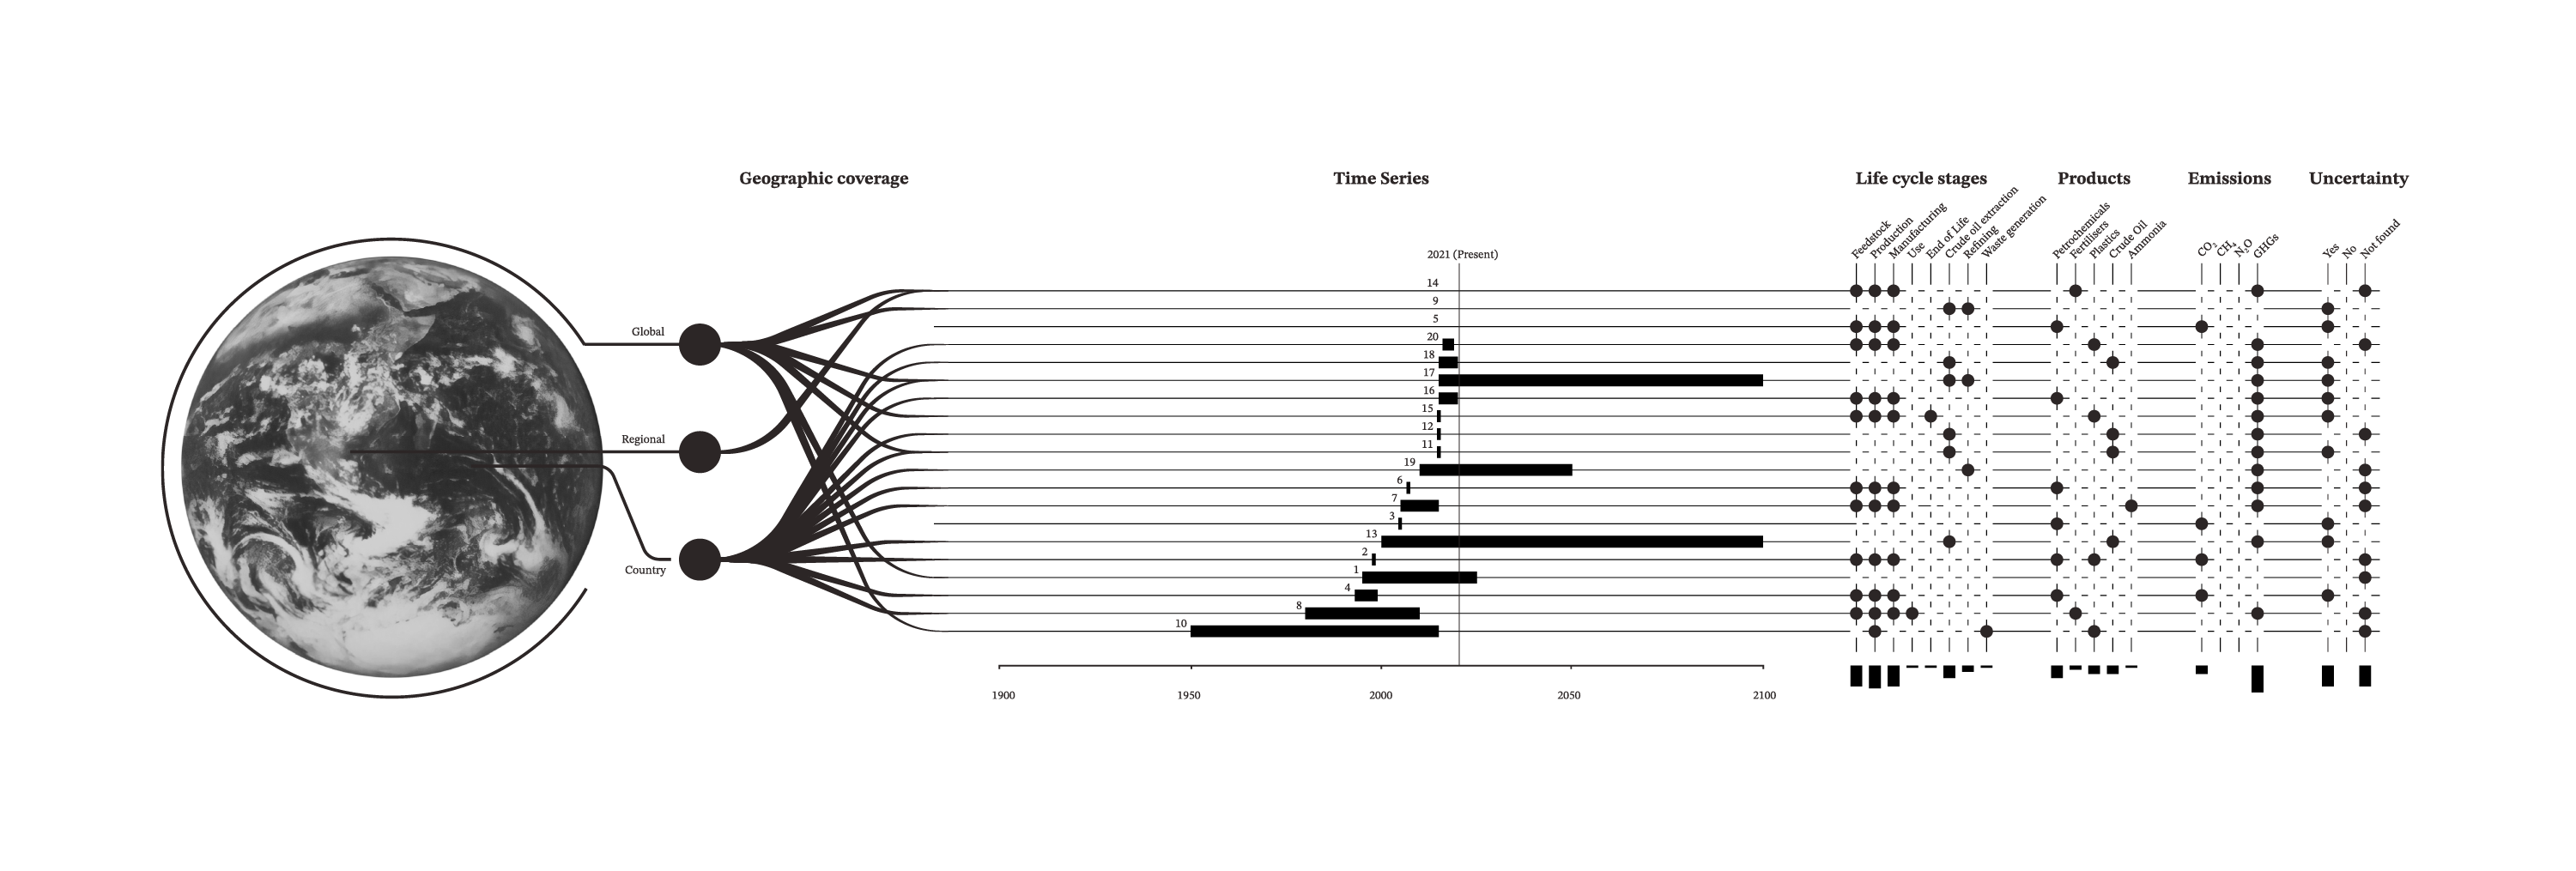
Figure 3–10: Time series reported in the selected studies.
C-THRU will address the complexity of supply chains and processes in the petrochemical sector by developing an integrated model that combines life cycle analysis with material flow analysis.
We will provide an accessible and reliable repository of global resource flows, emissions data, and mitigation options for the petrochemical sector, accounting explicitly for uncertainty. Based on these accounts, we will catalogue and model mitigation options and their potential impacts on emissions reductions. Our accounting will be mutually exclusive and collectively exhaustive, respecting mass and energy balancing across products, life cycle stages and regions. This project will create an open-source database on decarbonisation technologies that will be instrumental in documenting the technical viability, environmental impact, and economic performance of different decarbonisation scenarios.
This report has four chapters. Chapter 1 outlines the motivation for understanding the GHG emissions impact of the petrochemical sector. Chapter 2 describes the distinctive characteristics of the petrochemical sector and details the sources of emissions throughout the life cycle stages and across the different groups of petrochemicals. Chapter 3 examines how GHG emissions are reported, how supply chains are analysed, and how uncertainties in these data are managed. To conclude, Chapter 4 details the overall approaches of the C-THRU project.
