C-THRU

  • Home
    • About
  • News
    • Analysing the complexity of the petrochemical network

    • Too good to be true? How to make sure we use models wisely

    • What to Do about Plastics? Lessons from a Study of United Kingdom Plastics Flows

    • Planet-compatible pathways for transitioning the chemical industry

  • The Team
    • People
    • International Advisory Panel (IAP)
  • Projects
  • Publications
  • Events
  • Contact

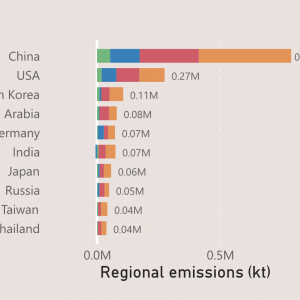
Global production emissions

Screenshot 2024-06-28 at 13.32.47

Emissions dashboard | Visualisation of global petrochemical production emissions

March 31, 2024

Greenhouse gas emissions from just the production stage of petrochemicals represent approximately 4% of all anthropogenic emissions. Visualise their breakdown across products and the globe with our latest interactive dashboard.

C-THRU Logo
University of Cambridge Logo
contact:
Jonathan Cullen | Email
copyright ©2020 C-THRU
made with by PrimeXeon.com