

Background to C-THRU
To discuss detailed C-THRU research updates, further the team’s knowledge, and promote collaboration, the C-THRU researchers have been holding regular seminars where each Workstream lead has delivered a talk on a subject related to the work of the project.
In May’s seminar session, Dr. Jonathan Cullen (Critical Review) presented on the background of C-THRU and the intricacies and importance of the mapping process.
Petrochemicals didn’t exist before the 1950s and make up about 7% of greenhouse gas emissions currently. They represent unique challenges with lots of materials and lots of products. Despite increasing efficiency and decreasing process energy inputs over the last 50 years, the demand for petrochemicals is ever growing and is set to double in production.
It is difficult to map the petrochemicals processes because the fuel that you put in becomes both the feedstock and the process energy that you use – this is often overlooked. Ultimately, we deal very differently with this industry compared to a supply chain like steel where the material is clearly steel or iron and the energy is clearly energy.
However this has also been a benefit for the petrochemical industry. The petrochemical supply chain can be measured in much better metrics as both inputs and outputs are measured in energy. We can see that output is a function of energy coming in compared with steel where input is both joules of energy and tonnes of iron ore, and output is tonnes of steel.
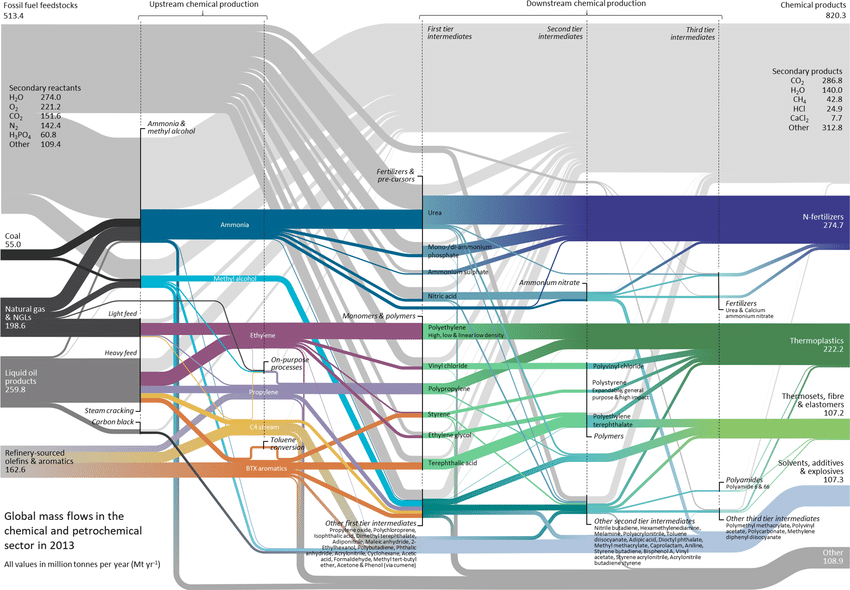
The above map from Peter Levi and Jonathan Cullen combines 80 processes, 100 materials, 200 references, represents 1.5 years of work and is the first time ever you can see this data in a transparent way. Every node is molar balanced and has a realistic industrial yield, with all secondary reactants and products included. This is a physical input-output of material flows rather than an input-output which uses monetary values.
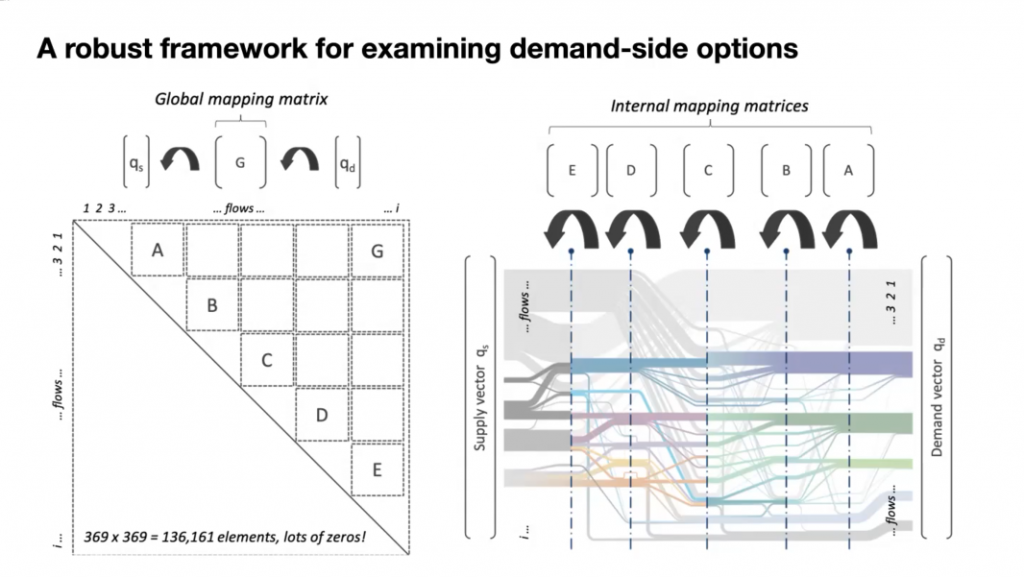
Behind each slice of the diagram is a matrix of what’s coming in and what can be allocated to the outputs. Mathematically we can bring all these matrices together to have one G-matrix which is a sum of everything going on in the industry. This means you can change your demand vector to seewhat happens to your supply vector, and therefore see what happens to your emissions. This lets us think about emissions across the whole supply chain and how we link them all together, i.e. when we make changes across the supply chain, which emissions change. To make meaningful comparisons across the supply chain you must have these links of materials throughout. Mapping chemical flows in this way is key to identifying where to act.