


Material flow analysis of polyurethane
To discuss detailed C-THRU research updates, further the team’s knowledge, and promote collaboration, the C-THRU researchers have been holding regular seminars. In February’s seminar session, Dr Chao (Chloe) Liang (Institute for Sustainability and Energy at Northwestern University) gave her presentation on the use of material flow analysis to further understand polyurethane flows.
Dr Chao (Chloe) Liang is a postdoctoral scholar in the Institute for Sustainability and Energy at Northwestern University. She earned her PhD in Chemical Engineering from Texas A&M University in 2019. Her research focuses on polymers and fuels from renewable resources. Her specialty includes material flow analysis, life cycle analysis, techno-economic analysis, process development, and mathematical modeling.
Polyurethanes (PUs) ranked sixth in worldwide production of polymers by weight in 2016. They are one of the most versatile materials in the world, creating many products including foams, sealants, and coatings. These products are used in every aspect of human life from vehicle to furniture to construction.
PUs are made from isocyanates and polyols which come from fossil fuels. Their production leads to greenhouse gas emissions and, at end-of-life, waste but be mostly disposed of. Landfilled waste leads to soil and water contamination and degradation of land quality and quantity. Incineration emits GHGs and toxins into the environment. In the US, PUs are hardly recycled and those that are can only be used to make cheap products.
To solve these problems Northwestern University, Argonne National Laboratory and their industrial partners set up a team called ResIn (Responsible Innovation for Highly Recyclable Plastics). It targets the PU family of polymers, developing biomass-derived PU or PU-like materials that could achieve high recyclability and benign degradation products at end-of-life.
ResIn used Material flow analysis (MFA) to understand PU relevant flows and stocks across different sectors giving a holistic view of PU value chains from feedstocks through to end-of-life. Through this analysis Dr Liang and the team determined challenges and opportunities for designing environmentally and economically beneficial materials and processes.
Many different data sources were used in this MFA study, which meant that inconsistencies between them had to be identified to characterise their uncertainty. This was done by considering factors such as source reliability and geographical and temporal representativeness. In this analysis issues with data were encountered. There are usually high fees for data which significantly reduced accessibility. A further issue is that some trade data were found to be misreported.
Figure 1 [1] shows the results of their MFA in Sankey diagram form. It tracks flows of PUs from the raw material production to manufacturing, use, trade, historical in-use stock, and waste collection and management.
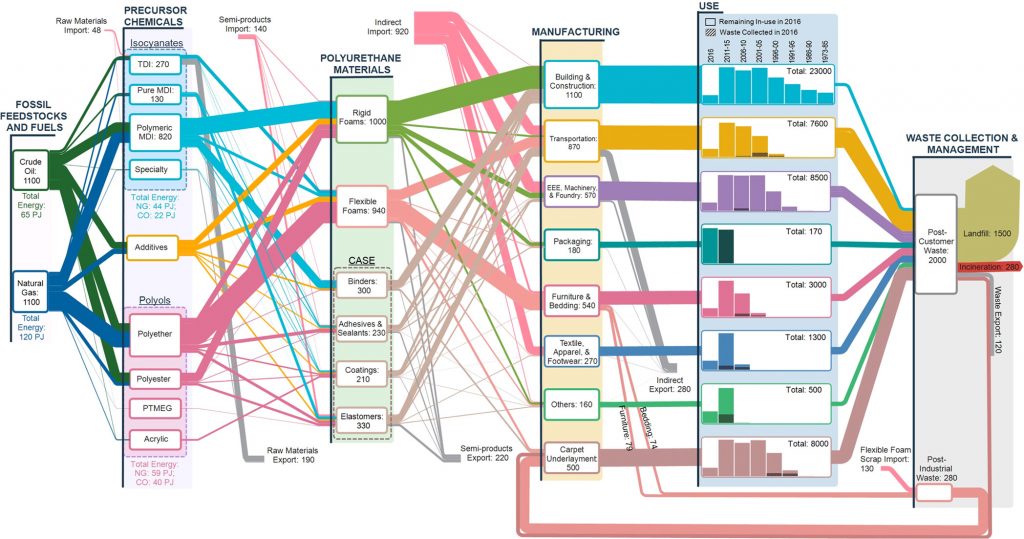
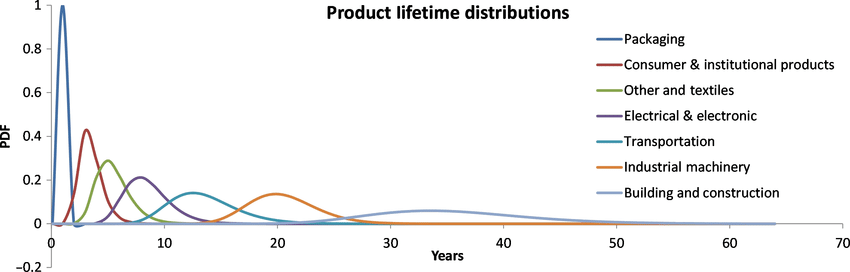
Building and construction, electronic equipment, and carpet underlayment account for the most in-use stock in the US. It is a combined effect of large annual production and a long product lifetime. The product lifetime distribution of different use sectors is shown in figure 2 showing lifetimes which range from less than one year for packaging to decades for buildings [2].
The only loop in the Sankey diagram is that of flexible foam which is recycled into carpet underlay. This is mechanically recycled using rebonding, the only Polyurethane recycling method that is in commercially used in the US today.
What are the opportunities for PU in the US?
There are ample feedstocks from waste that could support increased PU circularity. The waste of flexible foam and elastomers is almost equal to their domestic supply. For these, the waste coming out of the system now could be reused to almost satisfy the current market demand.
Secondly, chemical recycling offers an opportunity to reduce US demand for polyols for Polyurethane production. Currently the most widely investigated chemical recycling process is glycolysis which can be used to treat almost all PU types. Glycolysis could recover polyols for new PU synthesis, significantly reducing the demand for polyols in PU production in the US.
Finally, polymeric MDI and polyether polyol can be the two main targets to be made with biomass, which together account for more than 60% of the fossil fuel consumption for PUs production. If we replaced polymeric MDI with its bio-based equivalent, 46% of PUs in buildings and 10% in transportation would be bio-based.
[1] C. Liang et al., “Material Flows of Polyurethane in the United States,” Environ. Sci. Technol., vol. 55, no. 20, pp. 14215–14224, Oct. 2021, doi: 10.1021/ACS.EST.1C03654/SUPPL_FILE/ES1C03654_SI_001.PDF.
[2] R. Geyer, J. R. Jambeck, and K. L. Law, “Production, use, and fate of all plastics ever made,” Sci. Adv., vol. 3, no. 7, Jul. 2017, doi: 10.1126/sciadv.1700782.
Photo credit: Martin Adams