


Addressing uncertainty in modelling material and energy flows
To discuss detailed C-THRU research updates, further the team’s knowledge, and promote collaboration, the C-THRU researchers have been holding regular seminars. Dr Rick Lupton (Data modelling and uncertainty) recently presented on uncertainty in modelling material and energy flows.
Uncertainty is inevitable in modelling material and energy flows due to the diversity of data sources and availability of data, etc. Quantifying the uncertainty is crucial as it could affect the reliable results obtained and conclusions made by using such a flows model.
In Dr Rick Lupton’s talk, first, he introduced the Bayesian approach under the background of material flow analysis. A simple one-process material flow analysis model was used to explain how the material flow analysis works in the Bayesian framework.
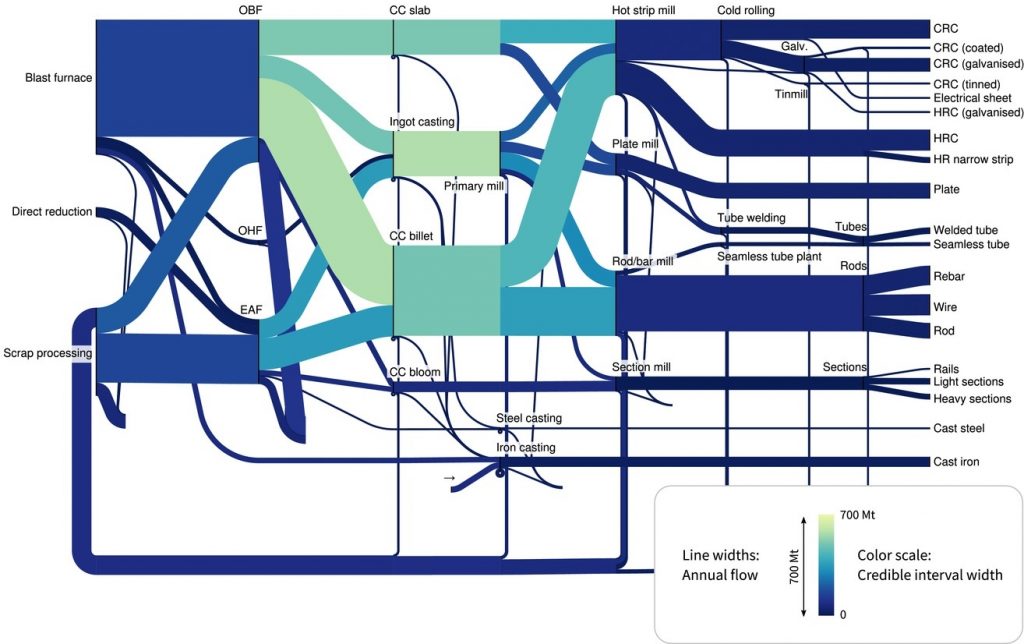
Secondly, he used an example of a Sankey diagram resulting from a global material flow analysis of iron to demonstrate the feasibility of the above idea as shown in Figure 2. In this diagram, the line width indicates the flow magnitude, while the colour indicates the level of uncertainty in the flow.
Thirdly, Dr Lupton provided a further example of quantifying the uncertainty associated with final and useful energy balances based on the Bayesian approach. Previously unpublished data about average end-use conversion device efficiency has been compiled and the useful energy balance of the UK has been calculated. The results show that the largest source of uncertainty is the allocation to energy end-uses, where the uncertainty of the energy flows goes from a median value of 5% to one of 34%. Useful energy consumption for transport and heating has low uncertainty (4–10%) and overall, 85% of consumption has uncertainties below an acceptable 25% threshold.
To apply the Bayesian approach to material and energy flow analysis, finally, Dr Rick Lupton pointed out that we need to (a) set up the model structure with hypotheses, (b) quantify initial knowledge about hypotheses, and (c) relate the observed data to the model. Dealing with uncertainty in modelling materials and energy can allow greater confidence in decision-making by highlighting how much uncertainty is there in the output of the flow and where further work/data is needed if a sensitivity analysis is conducted.
1. Lupton, R. C. & Allwood, J. M. Incremental Material Flow Analysis with Bayesian Inference. J. Ind. Ecol. 22, 1352–1364 (2018).
2. Paoli, L., Lupton, R. C. & Cullen, J. M. Useful energy balance for the UK: An uncertainty analysis. Appl. Energy 228, 176–188 (2018).
Photo credit: Robin Pierre